Exploratory Data Analysis of the School Census in the Immediate Geographic Region of Tatuí
Introduction
This study was conducted as a supporting tool for the completion of a final course project (TCC) to obtain the title of "MBA in Data Science and Analytics" from USP.
All data sources were freely obtained from the microdata published by "gov.br" at: Microdados Censo Escolar
The repository for this study can be accessed by clicking here.
The study consists of:
- Exploratory analysis using Python;
- A dashboard created in Power BI to facilitate the visualization of certain school census data.
Development
To guide the development, I sought to answer the following questions:
- General data analysis:
- What is the number of students in the immediate region of Tatuí?
- What is the number of teachers in the region?
- What are the numbers of student organized by stages of basic education?
- Where are the schools located?
- What is the difference in enrollment numbers between the years 2022 and 2023?
- Resource and infrastructure distribution:
- How are schools distributed by size (number of student and teachers) and location (rural or urban)?
- How is school infrastructure distributed?
- How are technological resources distributed in schools?
- Do schools have other professionals working besides teachers?
- Do schools have access to basic resources such as drinking water, restrooms and electricity?
- Inequality by gender and race:
- Is there a significant difference in enrollment rates between female and male students?
- What is the racial distribution of students?
Results:
Analysis in Python
The entire study has been stored in the repository: access it here.
Dashboard
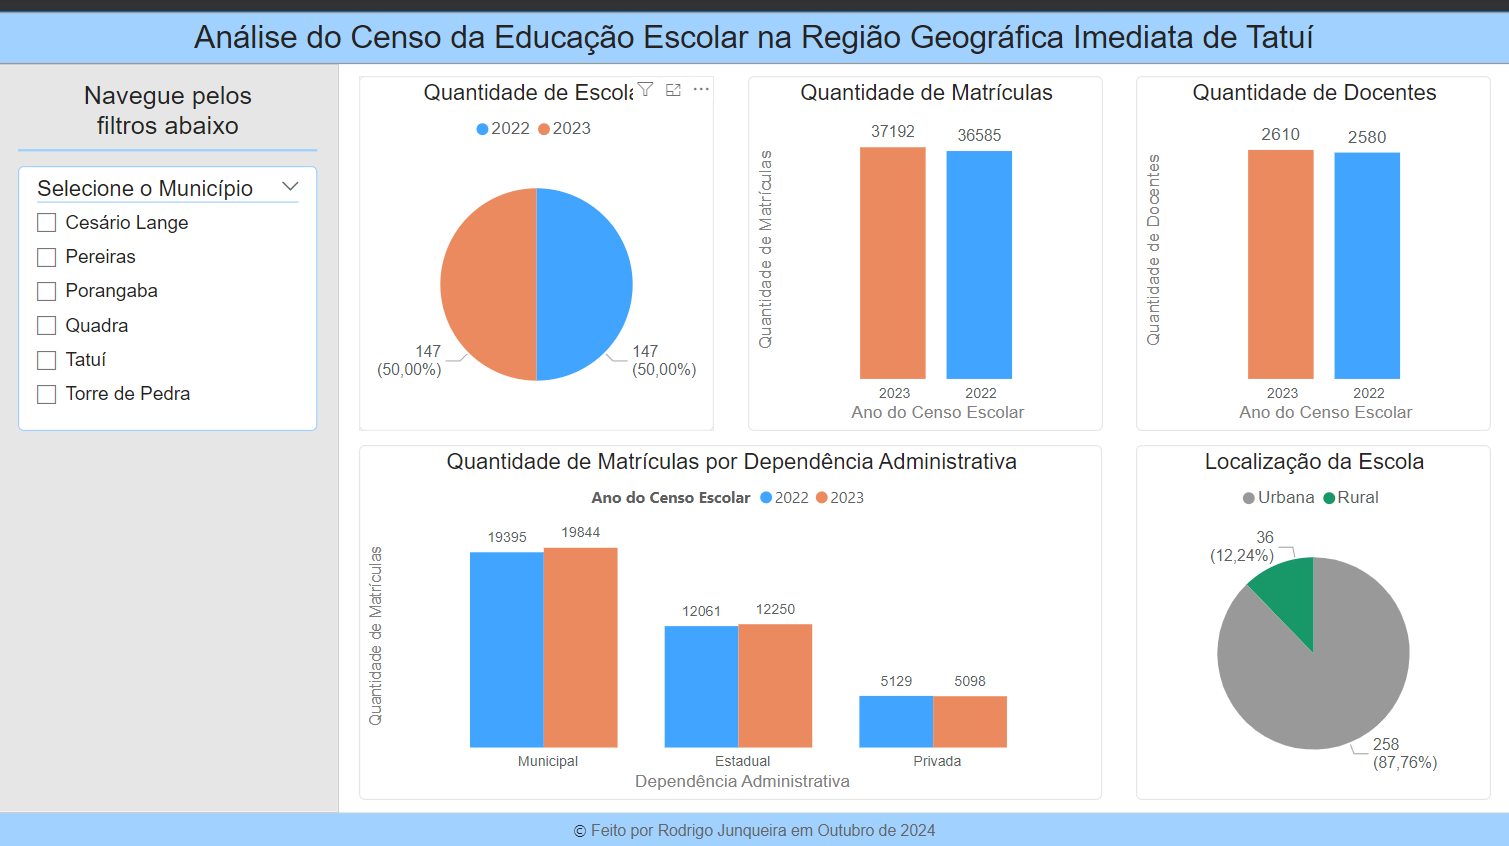
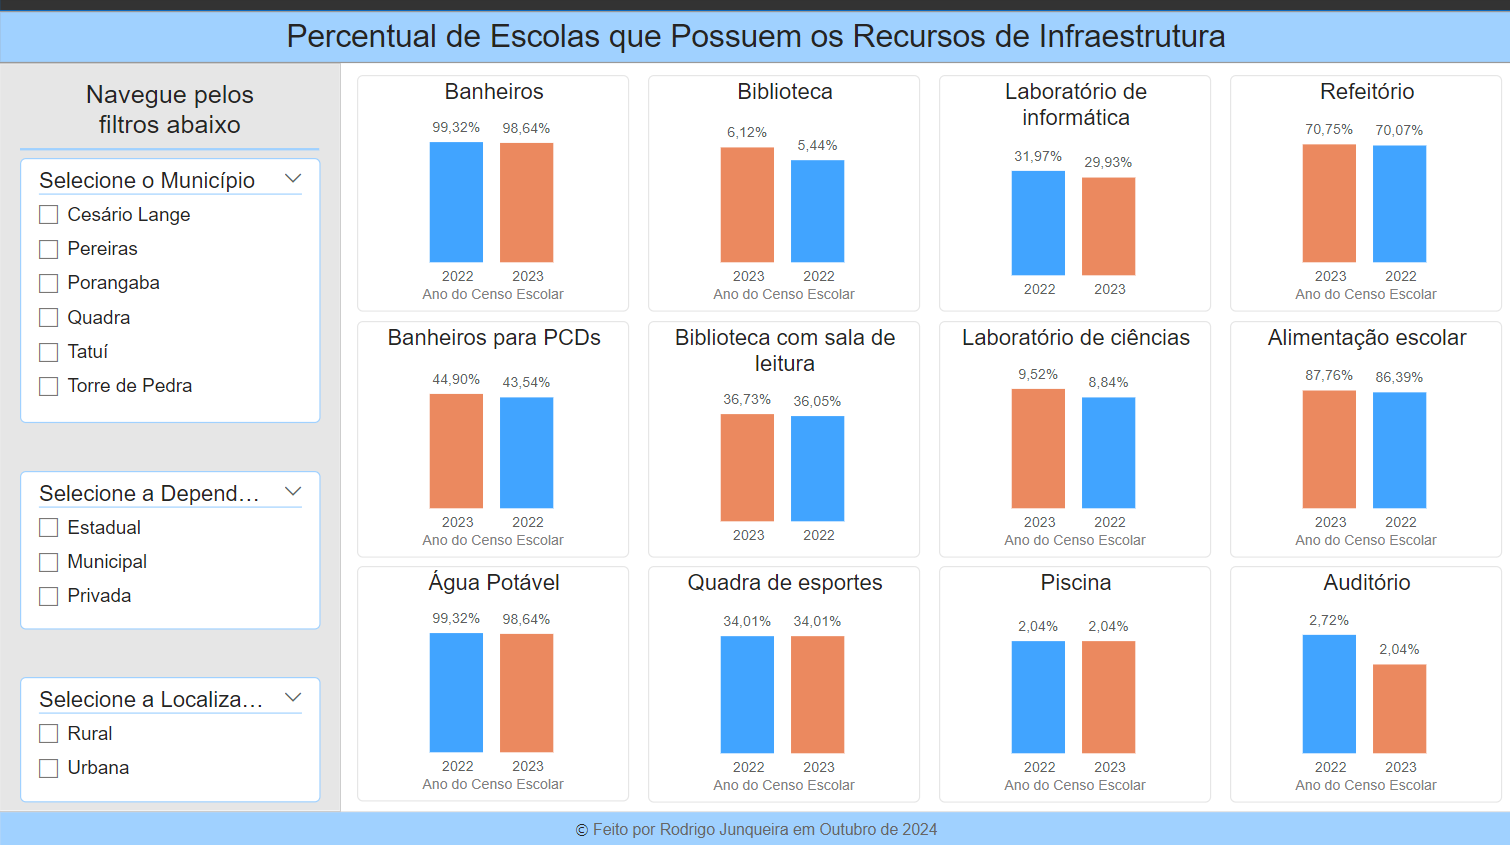
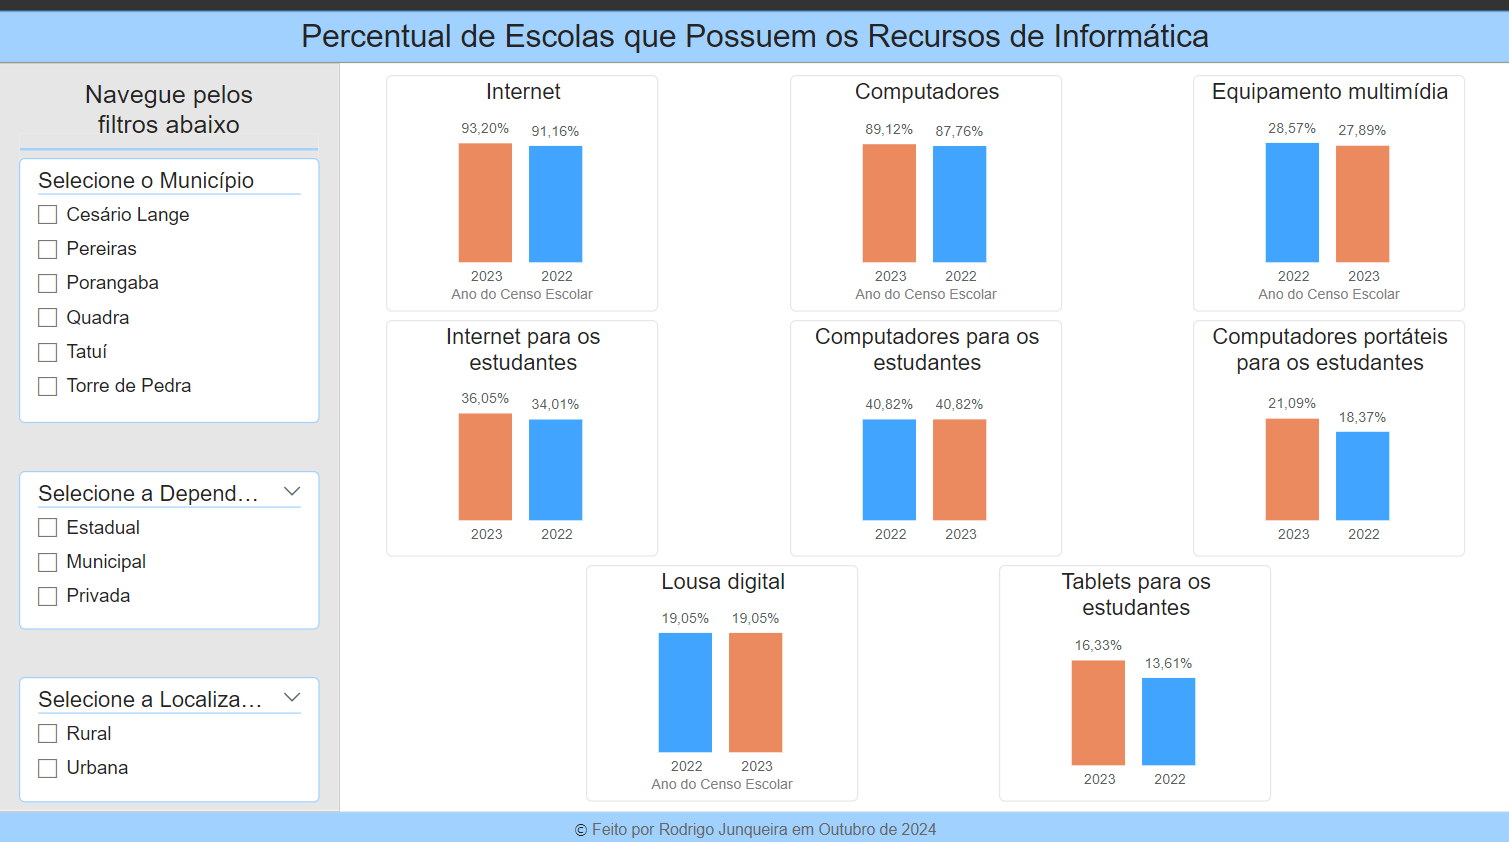
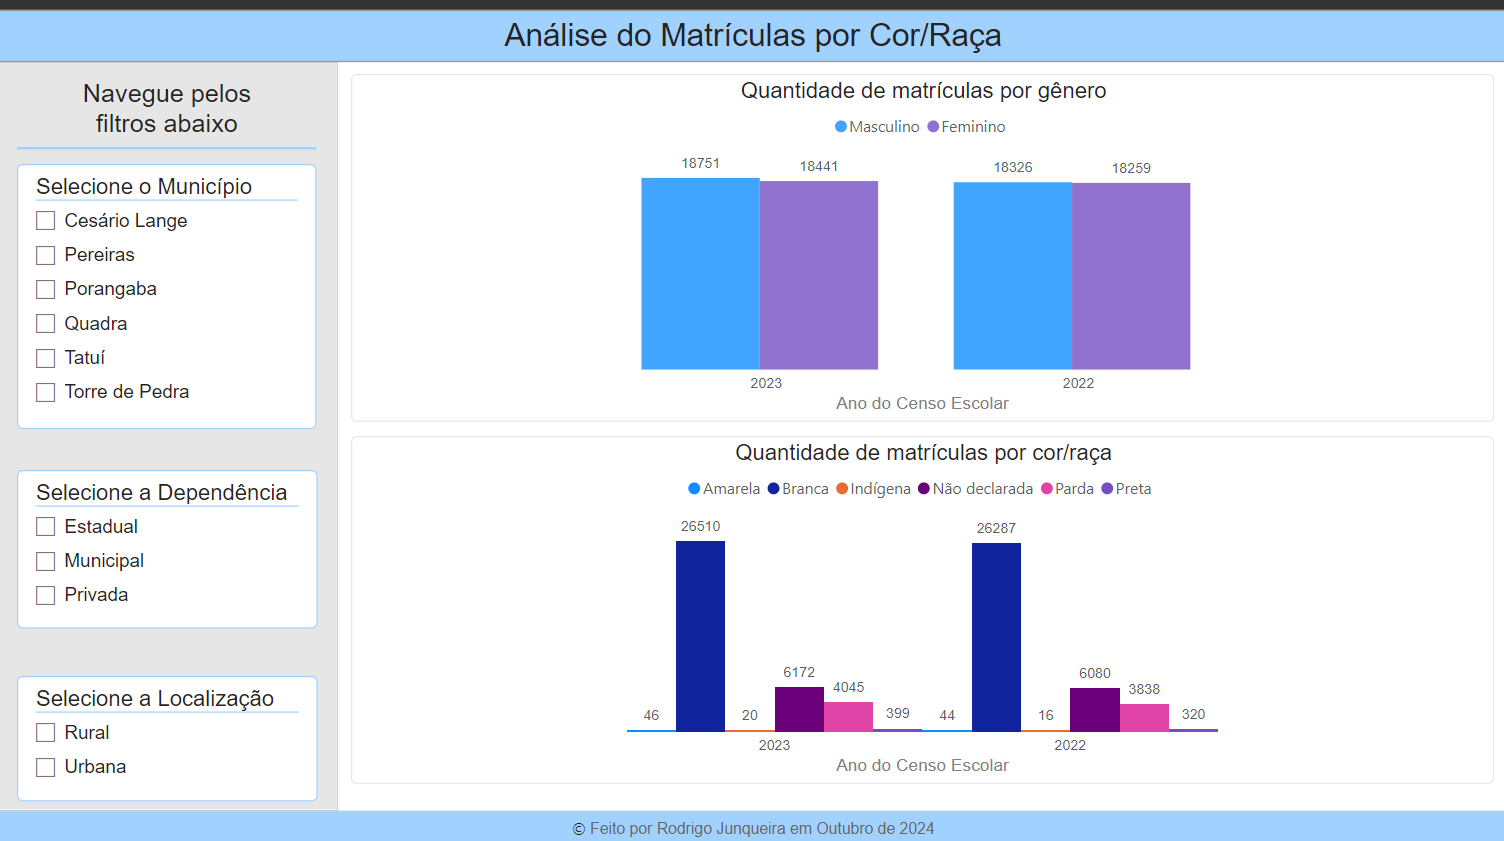
To answer the questions, I created a dashboard with four tabs:
- Overview
- Infrastructure
- IT Resources
- Gender and Race Analysis
Each tab includes filters to navigate between the municipalities within the immediate geographical region.


